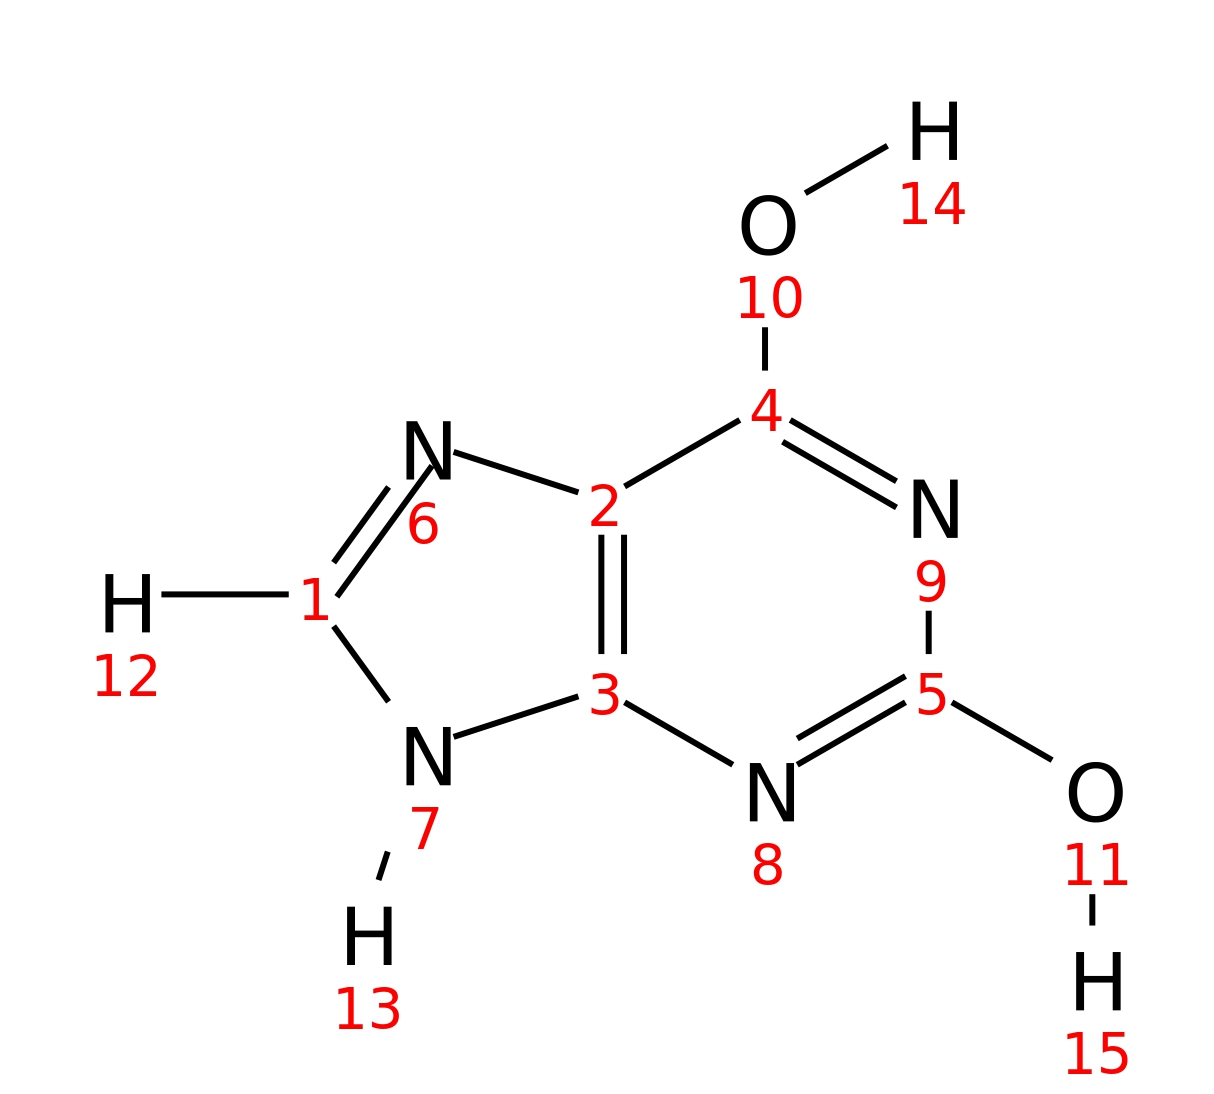
Xanthine
Simulation outputs:

|
Parameter | Value |
| Field strength | 400.13(MHz) | |
| RMSD of the fit | 0.00269 | |
| Temperature | 298 K | |
| pH | 7.4 | |
| InChI | InChI=1S/C5H4N4O2/c10-4-2-3(7-1-6-2)8-5(11)9-4/h1H,(H3,6,7,8,9,10,11) | |
| pKa | 0.8 | |
| pKa | 7.4 | |
| pKa | 11.1 | |
| Note 1 | None |
Sample description:
| Compound | Type | Concentration |
|---|---|---|
| Xanthine | Solute | Saturated1 |
| D2O | Solvent | 100% |
| DSS | Reference | 500uM |
Spin System Matrix
| 12 | |
|---|---|
| 12 | 7.716 |
Spectra
Select field strength to view simulated spectra and peak lists (standard and GSD): Autoscale
Help
To zoom into a region, draw a box around it.Hover over the x/y-axis and use mouse-wheel to zoom in/out.
Hover over the x/y-axis hold down left-button to move around the spectra.
(De)activate a spectrum by clicking on its legend.
| PPM | Amplitude | Peak Type |
|---|---|---|
| 7.71629 | 1.0 | standard |
| -0.960578 | 1.3125e-05 | standard |
| 7.71629 | 1.0 | standard |
| -0.951552 | 6.125e-06 | standard |
| 7.71629 | 1.0 | standard |
| -0.765776 | 3.125e-06 | standard |
| 7.71629 | 1.0 | standard |
| -0.971687 | 3.125e-06 | standard |
| 7.71629 | 1.0 | standard |
| -0.711719 | 2.125e-06 | standard |
| 7.71629 | 1.0 | standard |
| -0.960578 | 1.125e-06 | standard |
| 7.71629 | 1.0 | standard |
| 7.71629 | 1.0 | standard |
| 7.71629 | 1.0 | standard |
| 7.71629 | 1.0 | standard |
| 7.71629 | 1.0 | standard |
| 7.71629 | 1.0 | standard |
| 7.71629 | 1.0 | standard |
| 7.71629 | 1.0 | standard |
| 7.71629 | 1.0 | standard |
| 7.71629 | 1.0 | standard |
| 7.71629 | 1.0 | standard |
| 7.71629 | 1.0 | standard |
| 7.71629 | 1.0 | standard |